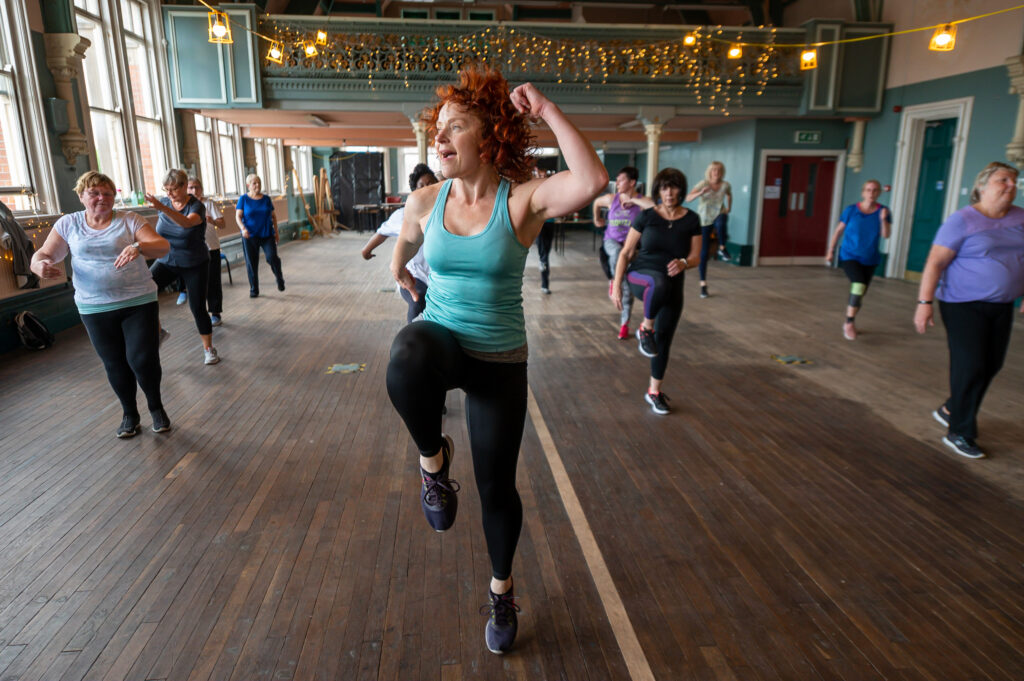

62.1% of adults in Greater Manchester are active*
This equates to 1,492,100 adults, and is the highest since the survey began (2015-16). This is a slight increase from the previous 12 months (61.3%) and indicates a longer term trend of recovery to pre-pandemic levels (62.0% in 2018-19).
*Active refers to Chief Medical Officer guidelines of 150 minutes of moderate intensity (raises heart rate) physical activity a week.
Locality headline data
With regards to locality data, headline figures are:
- In Bolton 55.7% are active which equates to 135,200 people, this is a decrease of 3.1% (58.8%%) compared to the previous 12 months.
- In Bury 62.6% are active which equates to 99,800 people, this is a decrease of 3.8% (66.4%) compared to the previous 12 months.
- In Manchester 66.3% are active which equates to 313,400 people, this is a decrease of 2.3% (64.0%) compared to the previous 12 months.
- In Oldham 56.6% are active which equates to 110,300 people, this is an increase of 2.1% (54.5%) compared to the previous 12 months.
- In Rochdale 58.0% are active which equates to 106,800 people, this is an increase of 4.1% (53.9%) compared to the previous 12 months.
- In Salford 57.7% are active which equates to 111,200 people, this is a decrease of 4.6% (62.3%) compared to the previous 12 months.
- In Stockport 67.8% are active which equates to 129,300 people, this is an increase of 5.5% (62.3%) compared to the previous 12 months.
- In Tameside 67.3% are active which equates to 159,600 people, this is an increase of 10.4% (56.9%) compared to the previous 12 months.
- In Trafford 68.5% are active which equates to 168,800 people, this is a increase of 5.6% (62.9%) compared to the previous 12 months.
- In Wigan 55.9% are active which equates to 157,100 people, this is a decrease of 5.6% (61.5%) compared to the previous 12 months.
Demographic headline data
Drawing on detailed demographic data for the year to November 2025 (when average inactivity for the GM adult population as a whole was 26.9%), inactivity was higher amongst the following groups:
- Females (28.3% inactive, compared to 25.2% of males)
- Older people (44.8% of those aged 75+ inactive, and 29.0% of 55-74 year olds, compared to 21.5% for those aged 16-34)
- Disabled people or those living with a long term health condition (44.1% inactive compared to 20.5% for non-disabled people)
- People in lower socio-economic groups (39% inactive, around double the 18.6% inactivity rate amongst those in higher socio-economic groups)
Recognising that intersectionality compounds inequalities, those with 2 or more characteristics of inequality are much more likely to be inactive 46.6% compared to those with 0 characteristics 15.3%.
Sport England Query Tool
More detailed Active Lives data can be accessed via the Sport England Active Lives query tool.