
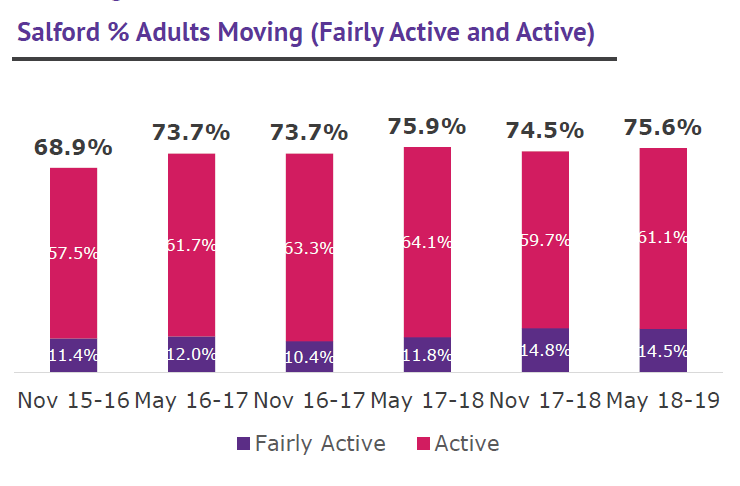
- This has changed over the last year:
- in the last 12 months (since May 2017-18) a decrease of 0.3% but 900 more adults moving
- in the last 6 months (since November 2017-18) an increase of 1.1%.
- Salford have closed the difference since baseline (November 2015-16) and are now above the Greater Manchester (GM) average of 73.3%.
There are significant inequalities in inactivity levels across people within a place.
-
Inactivity has decreased since 2015-16 for all demographics in Salford below, apart from NS SEC 3-5 and 75+ years.
-
It is highest for those aged 75+ and those with a disability.
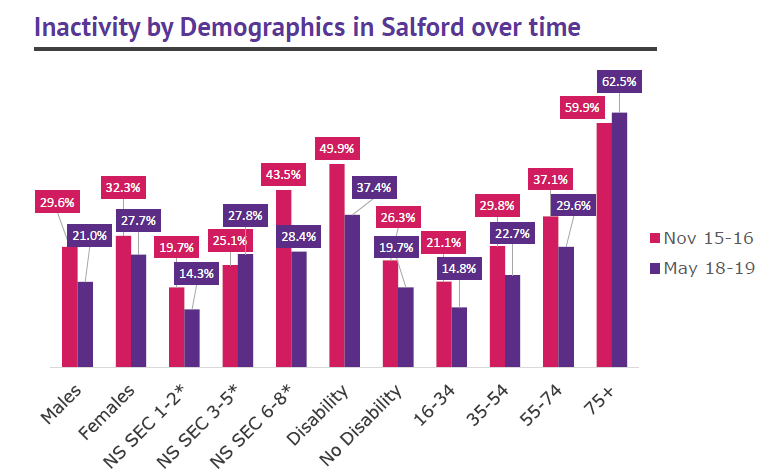
*Higher, Middle and Lower income categories in the National Statistics Socio-economic Classification