Greater Manchester Adult Activity Levels May 2019-20
The latest Active Lives results published by Sport England shows that 72.0% of adults in the region are active for at least 30 minutes a week, this equates to 1,621,700 adults moving. This is a decrease of 17,300 from the survey 12 months ago.
Greater Manchester Overview

The latest results from the Active Lives Survey shows a downturn in activity levels across Greater Manchester. The region now sees 72.0% of adults moving (active and fairly active), this equates to 1,621,700 adults. Since the first Active Lives release, November 2015/16, there has been an increase of 0.5% in the adult population moving, this is five times the national increase of 0.1%. However, activity levels in Greater Manchester still sit below the national average with 74.6% of adults moving nationally.
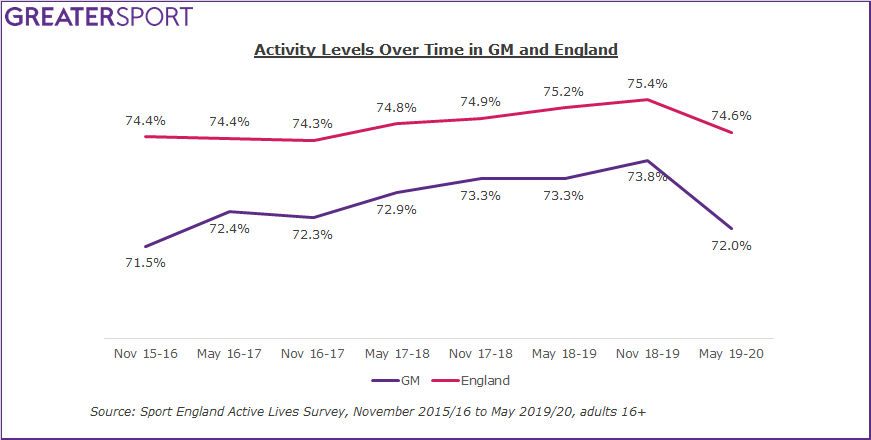
When this latest release is combined with activity data on children and young people, our progress towards our two key targets is clear.

Find out more about activity levels of children and young people in Greater Manchester here.
Borough Data
- Bolton Adult Activity Levels May 2019/20
- Bury Adult Activity Levels May 2019/20
- Manchester Adult Activity Levels May 2019/20
- Oldham Adult Activity Levels May 2019/20
- Rochdale Adult Activity Levels May 2019/20
- Salford Adult Activity Levels May 2019/20
- Stockport Adult Activity Levels May 2019/20
- Tameside Adult Activity Levels May 2019/20
- Trafford Adult Activity Levels May 2019/20
- Wigan Adult Activity Levels May 2019/20
Differences across the boroughs
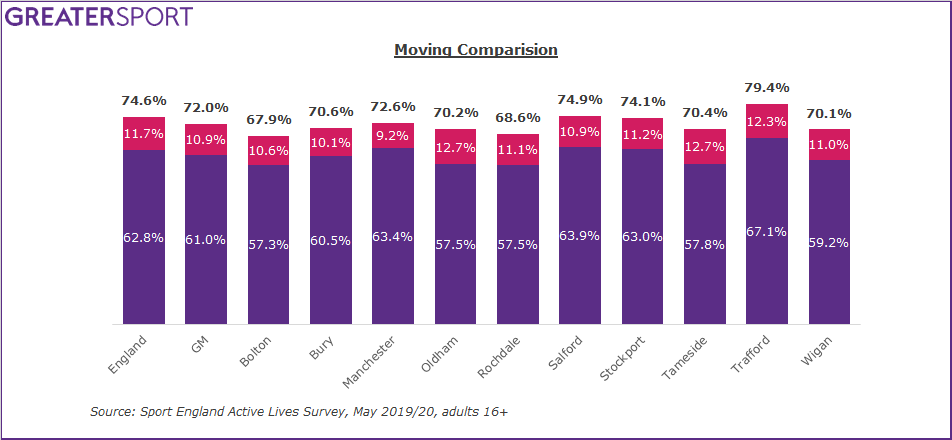
There also remains clear differences between the boroughs; there is a difference of 11.4% between the most active borough, Trafford, and the least active, Bolton.
Inactivity Across Demographics
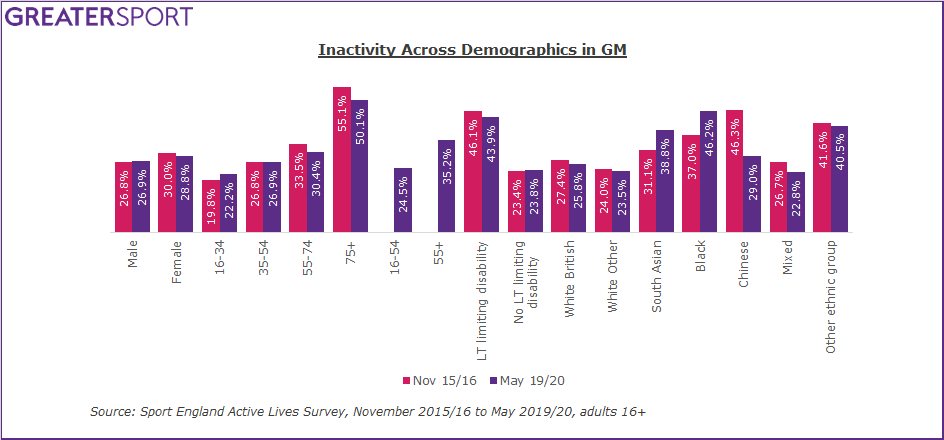
The largest inactivity gap amongst adults in Greater Manchester is the age gap with a 27.9% gap, the smallest is the gender gap with a 1.9% gap.
1.2% gender gap decrease since Nov 15/16
The inactivity gender gap in GM is 1.9%. This has been driven by an increase in inactivity amongst men (+0.1%) and a decrease in inactivity amongst women (-1.1%).
0.8% socio-economic gap increase since Nov 15/16
The inactivity socio-economic gap in GM is 19.4%. This is a result of an increase in inactivity amongst lower social groups (+0.3%) and a decrease in inactivity amongst higher social groups (-0.5%).
7.3% age gap decrease since Nov 15/16
The inactivity age gap in GM is 27.9%. This has been driven by an increase in inactivity amongst 16 to 34 year olds (+2.4%) and a decrease in inactivity amongst over 75's (-4.9%).
2.6% disability gap decrease since Nov 15/16
The inactivity disability gap in GM is 20.1%. This has been caused by an increase in inactivity amongst those with no long term limiting disabilities (+0.4%) and a decrease in inactivity amongst those with long term limiting disabilities (-2.1%).
Greater Manchester as a whole has seen inactivity decrease across four ethnic groups since November 2015/16: Chinese (-17.3%), Mixed (-4.0%), White British (-1.7%) and White Other (-0.6%). Inactivity has gone up amongst the three other ethnic groups: Black (+9.1%), South Asian (+7.7%) and Other (+4.3%).
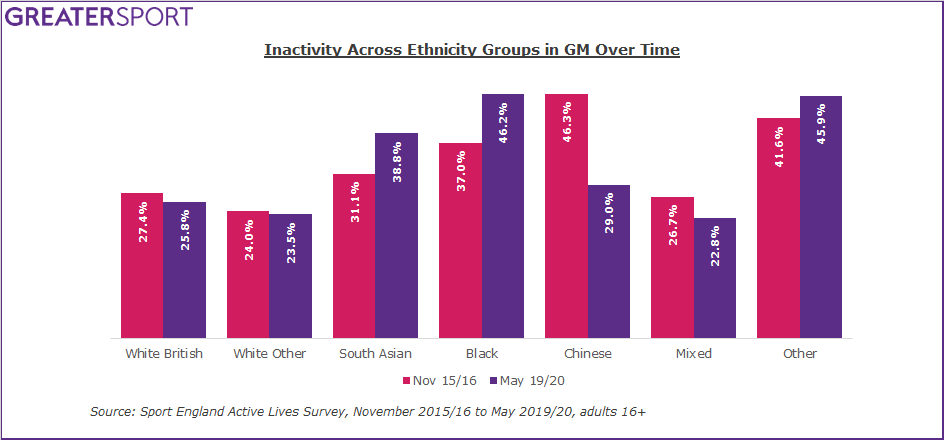
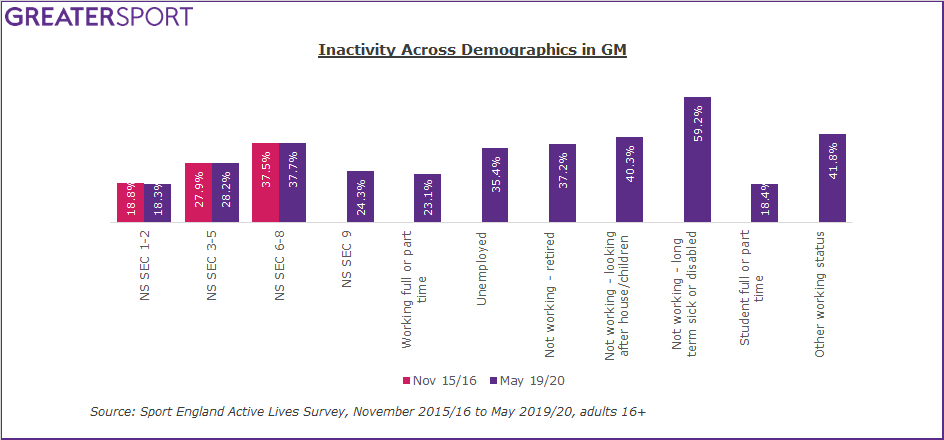
Overall, the highest levels of inactivity in GM are found amongst those not working - long term sick or disabled (59.2%), over 75's (50.1%) and those from a Black background (46.2%). The lowest levels of inactivity are amongst higher social groups (18.3%), full or part time students (18.4%) and 16 to 34 year olds (22.2%). The graphs below show the inactivity levels across all demographics in Greater Manchester where data is available.
More detailed information on each of the boroughs' activity levels can be found on this page under the heading 'Borough Data'.
