Wigan Adult Activity Levels 2021-22
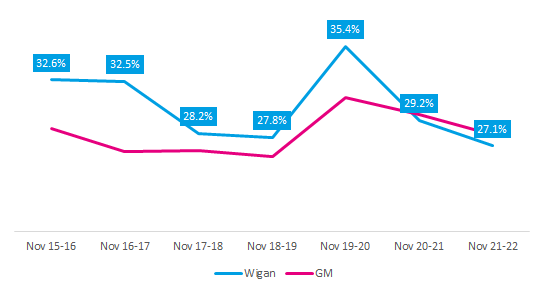
Wigan has recovered to baseline levels for both active (60.6%) and inactive (27.1%), but only inactive for pre-pandemic levels.

Wigan Overview
Wigan has recovered to baseline levels for both active (60.6%) and inactive (27.1%), but only inactive for pre-pandemic levels and is now below GM levels.
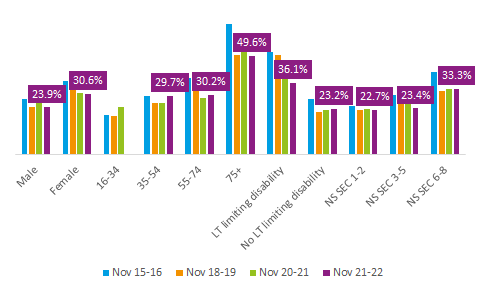
All demographics were seeing reducing inactivity prior to the pandemic. All have recovered to baseline and most pre-pandemic, except 35-54 years and NS SEC 6-8 groups.
Largest gap between male and female inactivity in Wigan compared to the rest of GM, with males being less inactive in Wigan than GM and vice versa for females.
Inactivity
The inactive population has seen a decrease in the last 12 months (-2.1%), is below baseline (-5.5%) and pre-pandemic levels (-0.7%).
Differences across demographics
All demographics were seeing reducing inactivity levels prior to the pandemic.
Most have seen a decrease in the last 12 months, except 35-54 and 55-74 years.
All have recovered to baseline and most pre-pandemic, except 35-54 years and NS SEC 6-8 groups.
Largest gap between male and female inactivity, with males being less inactive in Wigan than GM and vice versa for females.
Those with a long-term health condition or from NS SEC 6-8 groups are much less inactive in Wigan than GM. However, NS SEC 1-2 groups are more inactive in Wigan than GM.
If you have questions about this data please email: [email protected]
Published April 2023