Trafford Adult Activity Levels Nov 2020-21
The latest Active Lives results published by Sport England show that 74.6% of adults in Trafford are active for at least 30 minutes a week, equating to 139,400 adults moving; a decrease of 4,400 from the survey 12 months ago.
Trafford Overview
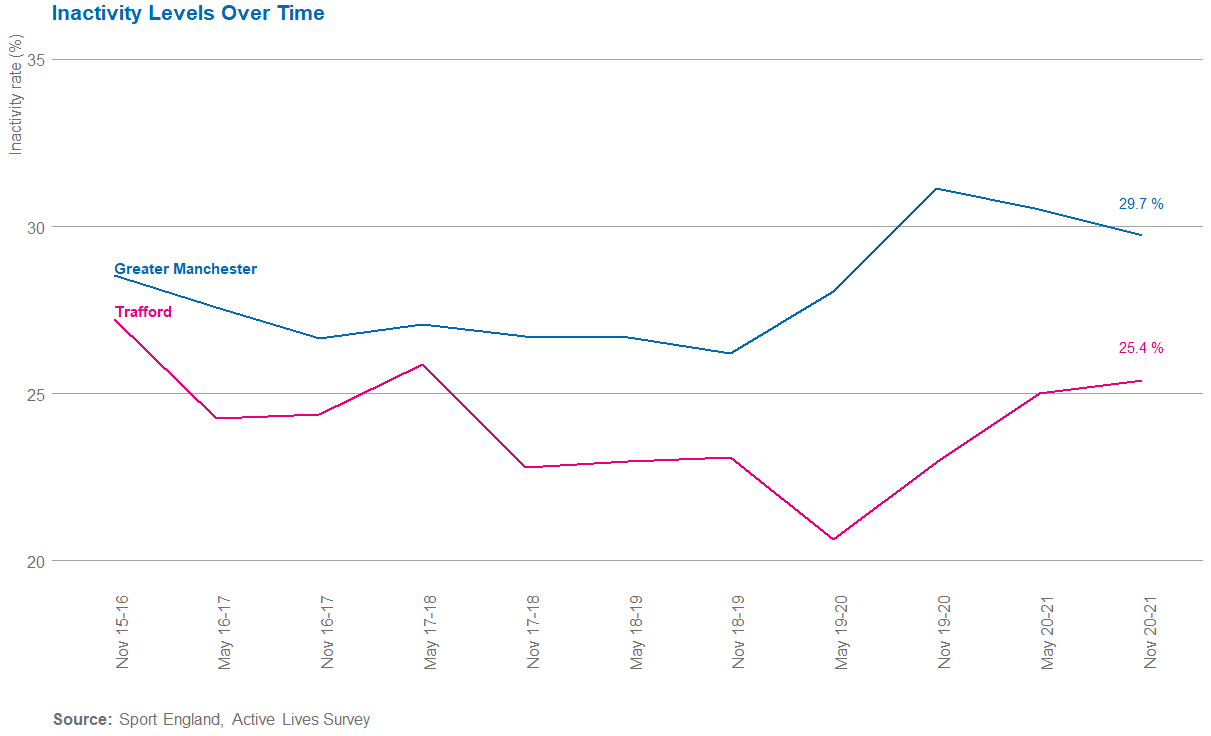
Inactivity in Trafford appeared to be less impacted by the pandemic than in Greater Manchester (GM), but inactivity is continuing to rise rather than show any signs of recovery.
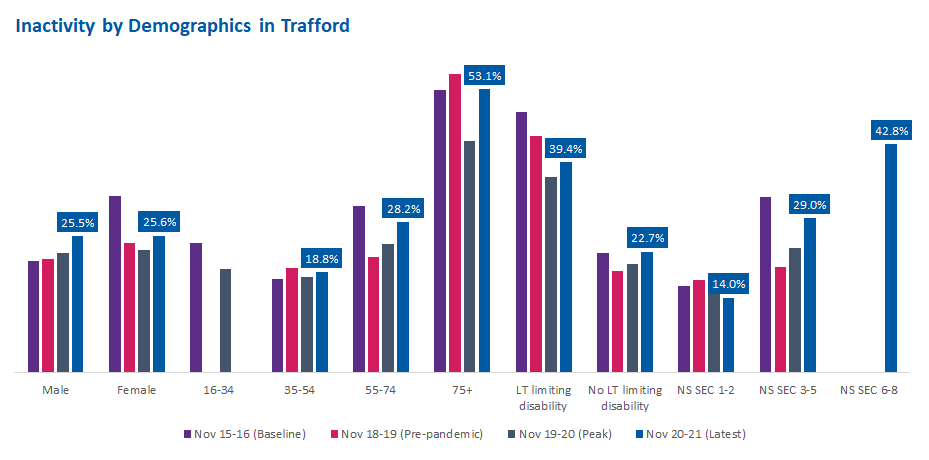
This is consistent across most demographics (where there is sufficient data to make a comparison), except higher socio-economic groups (NS SEC 1-2). In particular those aged 75+ years and from lower socio-economic groups (NS SEC 6-8) have higher rates of inactivity in Trafford than GM. Whilst females, those aged 35-54 years, those with a long term limiting health condition or disability (LTHC) and from higher socio-economic groups (NS SEC 1-2) are much less inactive (by nearly 5% or more for all of these).
Walking for leisure is at its highest, however fitness activities, cycling and walking for travel are decreasing, whilst sporting activities appear to be stabilising.
Moving Rates
74.6% of adults in Trafford are now moving (active and fairly active), this equates to 139,400 adults. Since Active Lives launched, November 2015-16, inactivity in Trafford has decreased by 1.8%, meanwhile in Greater Manchester the rate has increased by 1.2%, in the last 12 months it has risen by 2.5% in Trafford.

Demographic data

 |
The inactivity gender gap in Trafford is 2.4%Since November 15/16 the gender gap has decreased by 9.8%. This change is due to a large decrease in inactivity amongst women (-7.4) and an increase in inactivity amongst men (+4.6%). |
|
|
Inactivity socio-economic gap in Trafford is 28.8%Since November 16/17 the socio-economic gap has increased by 22.5%. This change is due to a large decrease in inactivity amongst lower socio-economic groups (+18.2%) NS SEC 6-8, and a decrease in inactivity amongst higher soico-econimic groups (+4.3%) NS SEC 1-2. Learn more about activity levels related to socio-economic status here |
 |
The inactivity disability gap in Trafford is 16.7%Since November 15/16 the disability gap has decreased by 9.7%. This is due to an increase in inactivity amongst those without a long term limiting disability (+0.2%) and a decrease in inactivity amongst those with a long term limiting disability (-9.5%). Learn more about activity levels related to disability and long term health conditions here |
 |
The inactivity age gap in TraffordThere was insufficient data collected from lower socio-economic groups within Trafford for any statistical analysis. |
 |
EthnicityDue to limited sample sizes we have limited ethnicity data across the Greater Manchester boroughs. In Trafford 23.6% of those from a White British background are inactive compared to 41.6% of those from a South Asian background. |
If you have questions about this data please email: [email protected]
Published April 2022

