Greater Manchester Activity Levels Nov 20-21: Socio-Economic
A detailed breakdown of the latest Active Lives research from Sport England exploring the differences in activity levels by socio-economic status across Greater Manchester.

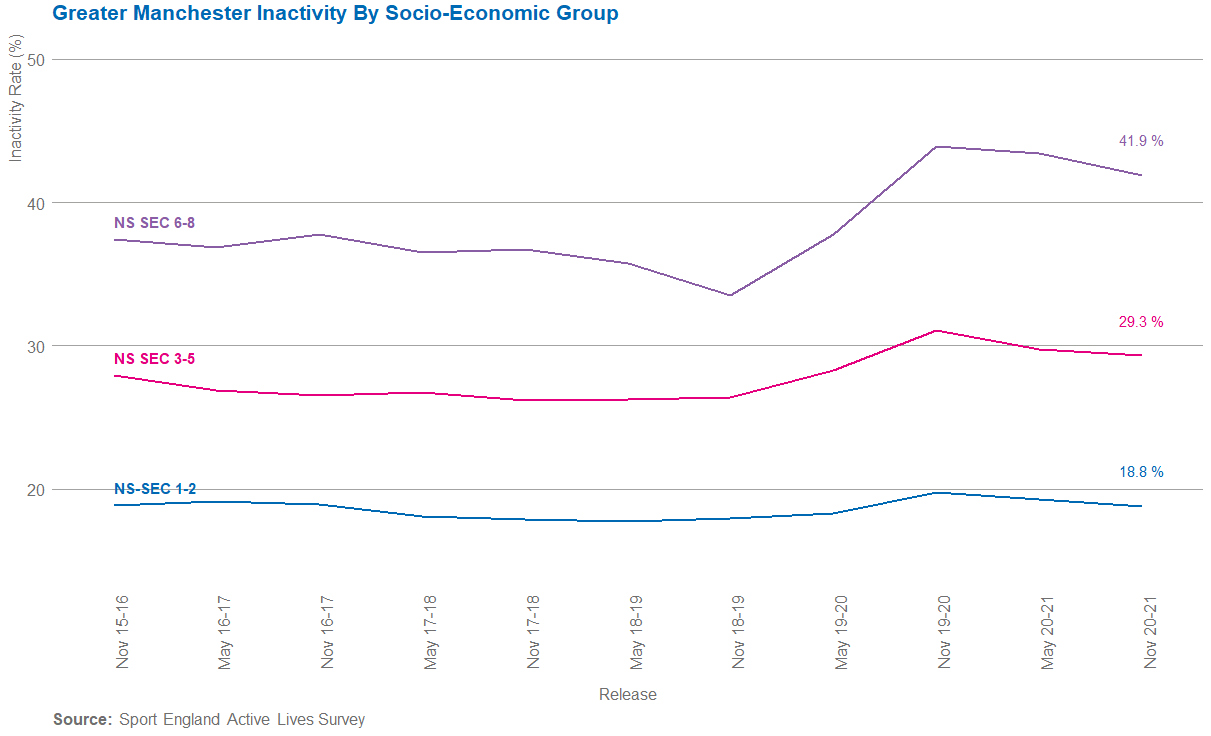
In Greater Manchester the inactivity socio-economic gap is 23.1%, this gap has widened since November 2015/16 (baseline) by 4.5%. Whilst in the same time frame England has seen the gap close by 7.9%. Whilst inactivity has remained the same for higher social groups (NS-SEC 1-2), inactivity has increased (+4.4%) for lower social groups (NS-SEC 6-8) in Greater Manchester.
When looking at the changes over time it's clear that the widening of the gap has primarily been driven by an increase in inactivity during 2019-20, with the rate of increase being related to social group. The latest release has seen a plateauing in inactivity amongst lower social groups and higher social groups and a decline amongst middle social groups. However, due to the previous significant increase in inactivity amongst lower social groups rate of inactivity remains considerably higher compared to higher social groups.
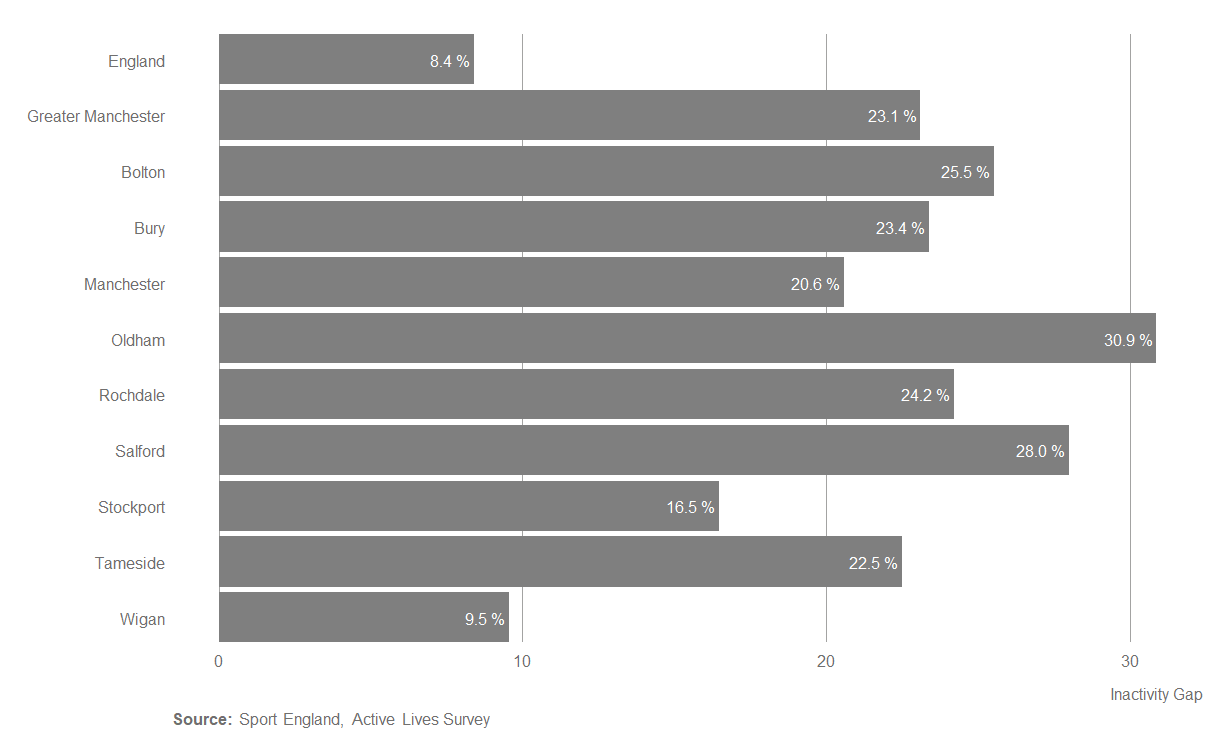
Borough Picture
None of the boroughs have a smaller inactivity gap than England, with Oldham having the highest (30.9%) and Wigan the lowest (9.5%). However, this disguises the large increase in the socio-economic gap in Bury, at baseline the gap was just 5.2%. Overall, just three boroughs, Bolton, Manchester, and Wigan, have seen a narrowing of the gap since baseline (-7.1%, -1.9%, -7.4%).
Sport England, through their Tackling Inactivity and Economic Disadvantage programme, offers further information on how to engage those from low socio-economic backgrounds in physical activity.
More information on the latest Active Lives release can be found here.
If you have questions about this data please email: [email protected]