Greater Manchester Activity Levels Nov 19-20: Gender
A detailed breakdown of the latest Active Lives research from Sport England exploring the differences in activity levels by gender across Greater Manchester.
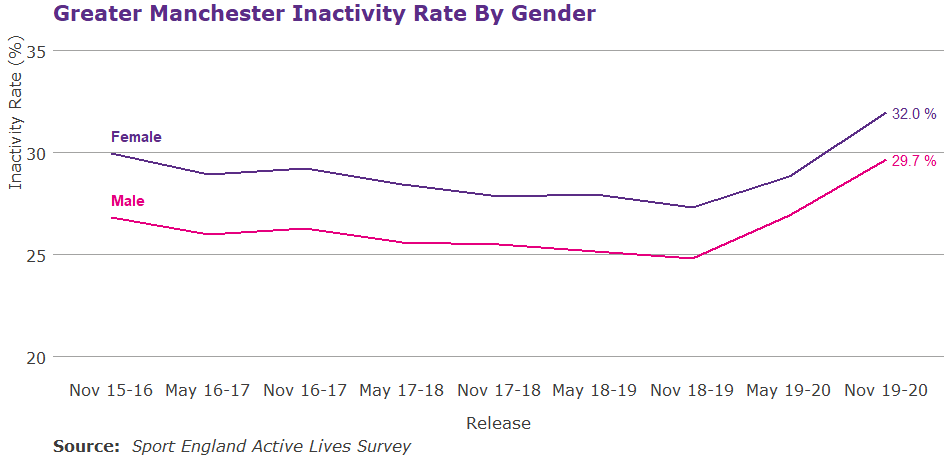
The gap between male and female inactivity in Greater Manchester is 2.3% and has reduced by 0.8% since November 2015/16 (baseline). However, the narrowing of the gap is a result of increases in inactivity amongst both men and women with men's inactivity rising faster than women's, 2.9% v 2.0%.
Borough Comparison
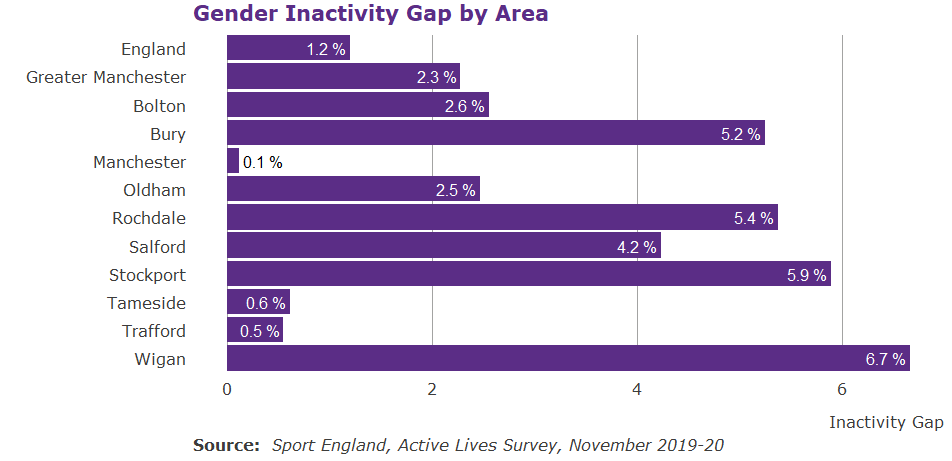
Greater Manchester has a gender inactivity gap almost twice the national gap, 2.3% compared to 1.2%. There are just three boroughs, Manchester, Tameside and Trafford, that have smaller gender gaps than seen nationally. Whilst we typically see women having higher rates of inactivity than men this is not the picture in all areas; Bolton and Oldham both have higher rates of inactivity amongst men than women. Since baseline half of the boroughs, Bury, Oldham, Rochdale, Salford and Stockport, have seen the gender gap increase.
Gender and Other Factors
We know that numerous factors intersect and compound the differences we see in activity levels amongst different cohorts. As such it is important to not look at demographics in isolation.
Age
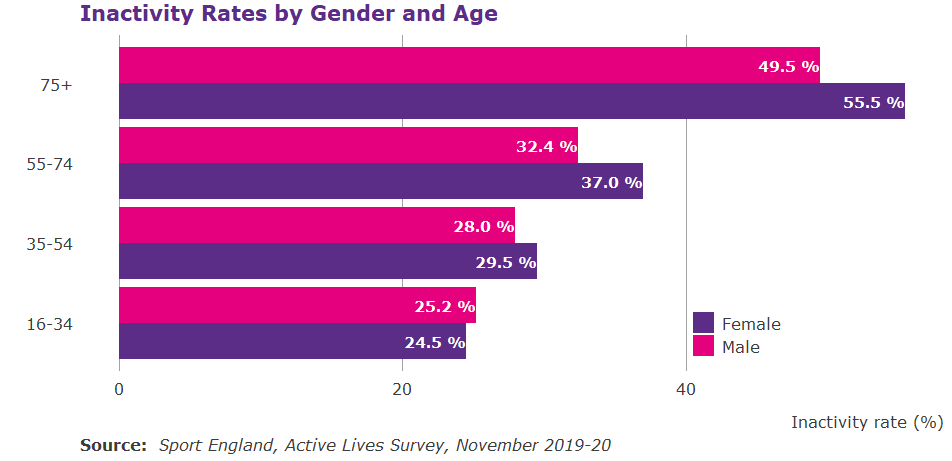
Overall in Greater Manchester the inactivity age gap is 27.8%, however, amongst men the gap is just 24.3% whereas amongst women it is 31.0%. What is of particular interest is that women have lower rates of inactivity than men when they are younger, 16 to 34 years old. However women's inactivity levels increase at a greater rate than men's, resulting in all other age groups seeing a higher level of female inactivity than male.
Disability
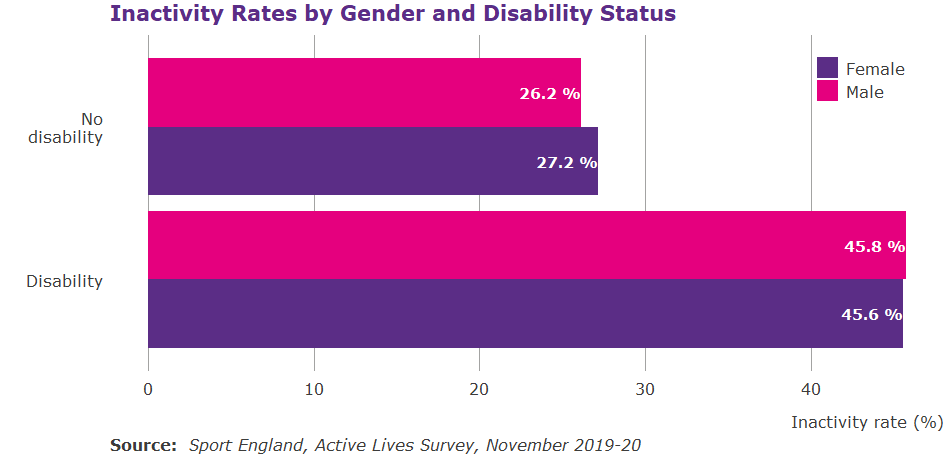
Overall in Greater Manchester the disability gap is 19.4%, however, when this is broken down by gender there is slight variance. Amongst those with no disability, female inactivity is higher. However, amongst those with a disability, male inactivity is fractionally higher. This drives a larger disability gap amongst men, 19.6%, compared to women, 18.4%.
Ethnicity
Whilst inactivity is typically higher amongst females this is not seen amongst South Asians where men have a higher rate of inactivity. The smallest gender gap is also seen within the South Asian population, at 1.9%, smaller than the Greater Manchester gender inactivity gap as a whole. Whilst South Asians have the smallest gap between men and women they have the highest rates of inactivity across ethnicity and gender.
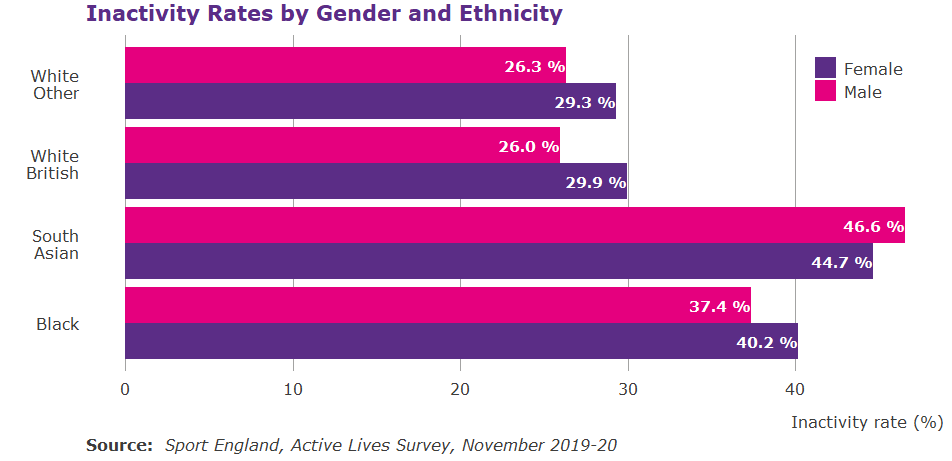
N.B Due to insufficient sample size inactivity rates could not be calculated for Mixed or Other ethnic groups.
Living Arrangement
Whilst living arrangements do see some variance in inactivity rates by gender the most notable inactivity rates are amongst lone parents. This cohort sees the lowest levels of female inactivity, 29.5%, and male inactivity is significantly higher, 45.0%. This marks a 15.5% gender gap for lone parents, compared to the next highest gender gap by living arrangement which is 3.6% by couple.
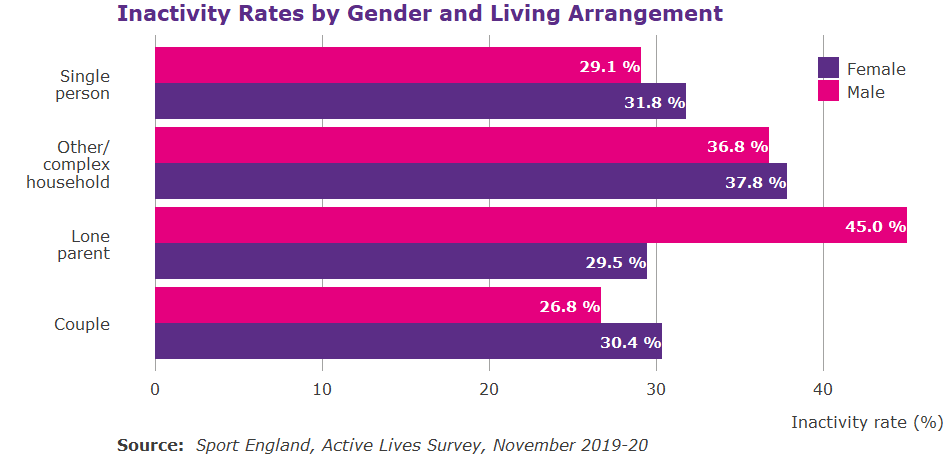
N.B. 'Couples' and 'Other/complex household' categories include households where children may be present.
Socio-economic status
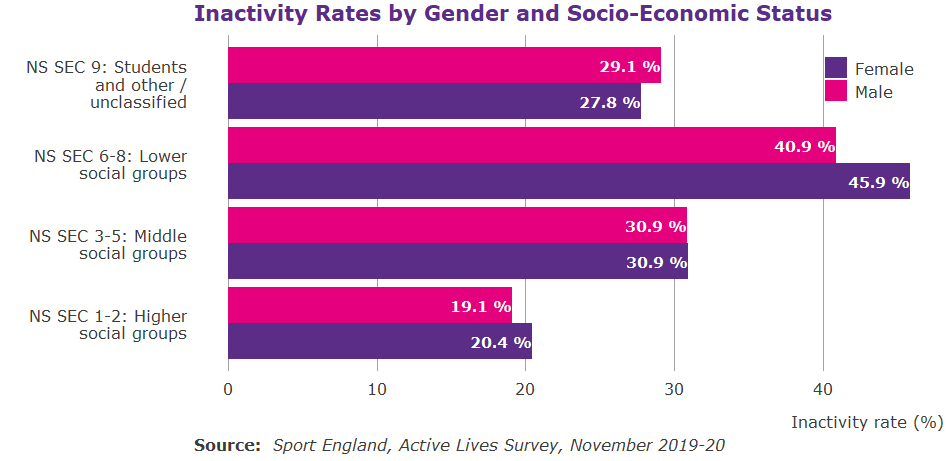
Overall in Greater Manchester the socio-economic gap is 24.2%, however when this is broken down by gender the gap is greater amongst women, 25.5%, than amongst men, 21.8%. The greatest gender difference is seen between those from lower social groups where there is a 5.0% gap in inactivity between men and women, amongst middle social groups there is no difference in inactivity by gender. However, amongst NS-SEC 9, students and others, the gap is inverted with men having a higher rate of inactivity.
Employment status
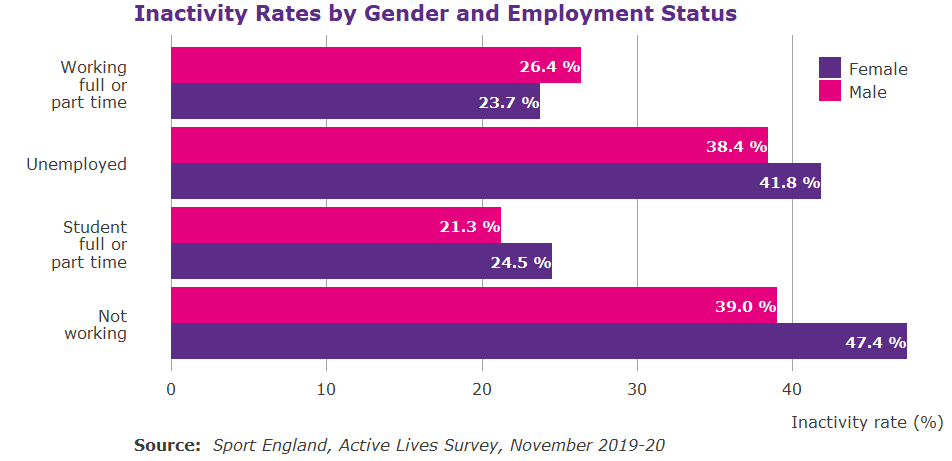
Employment status sees some of the largest gender gaps in the population data. With the exception of working full or part time, female inactivity is always higher than male inactivity. This is most noticeable amongst those not working, where there is an 8.4% gap with almost half of women being inactive. Working full or part time not only sees an inversed gender gap but also the smallest gender gap, 2.7%.
If you want to find out more about engaging women in physical activity take a look at Women in Sport’s website. Find out more about the relationship between gender and physical activity here.
More information on the latest Active Lives release can be found here.
If you have questions about this data please email: [email protected]
All data is rounded to one decimal point.
Published June 2021
