GM Moving
Impact & Evidence
Data and stories that show our shared impact on physical activity, wellbeing and inequalities across Greater Manchester.
Making moving matter more
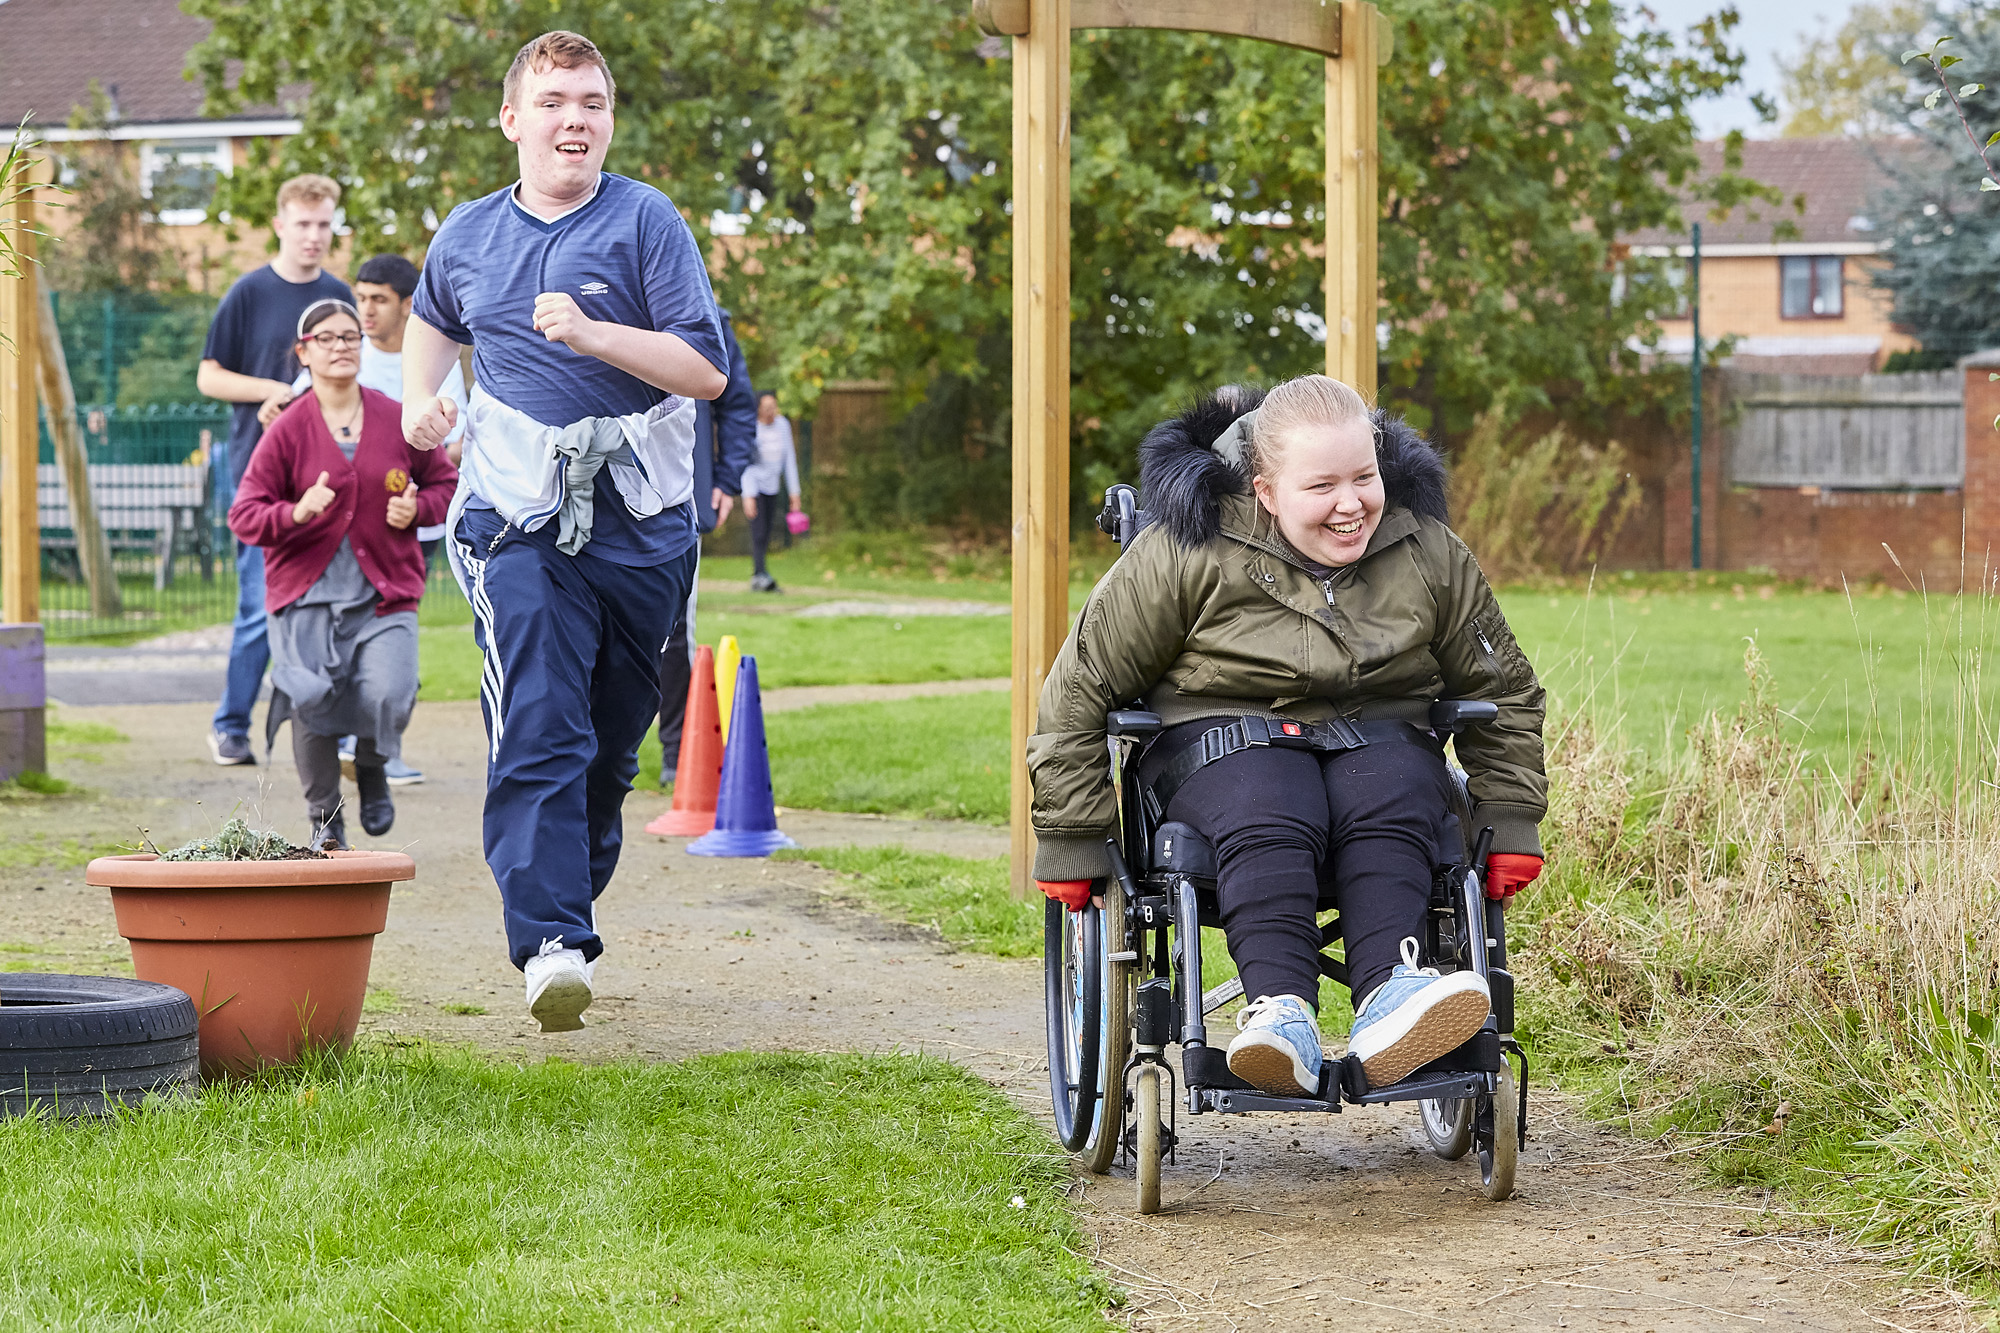
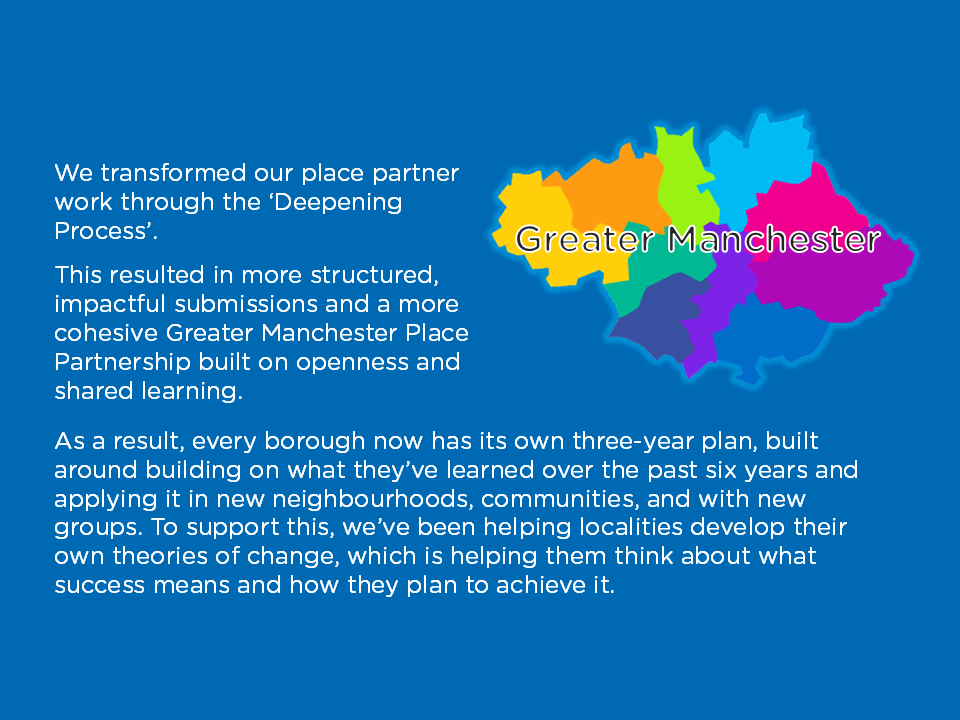
We work tirelessly across all parts of the Greater Manchester community to help improve access and opportunities for people to move more. From grassroots clubs to public sector organisations, from local sports teams to national governing bodies, we’ve been making great progress towards our goal of ‘active lives for all’.
Our organisational impact
Explore the Story of our Work
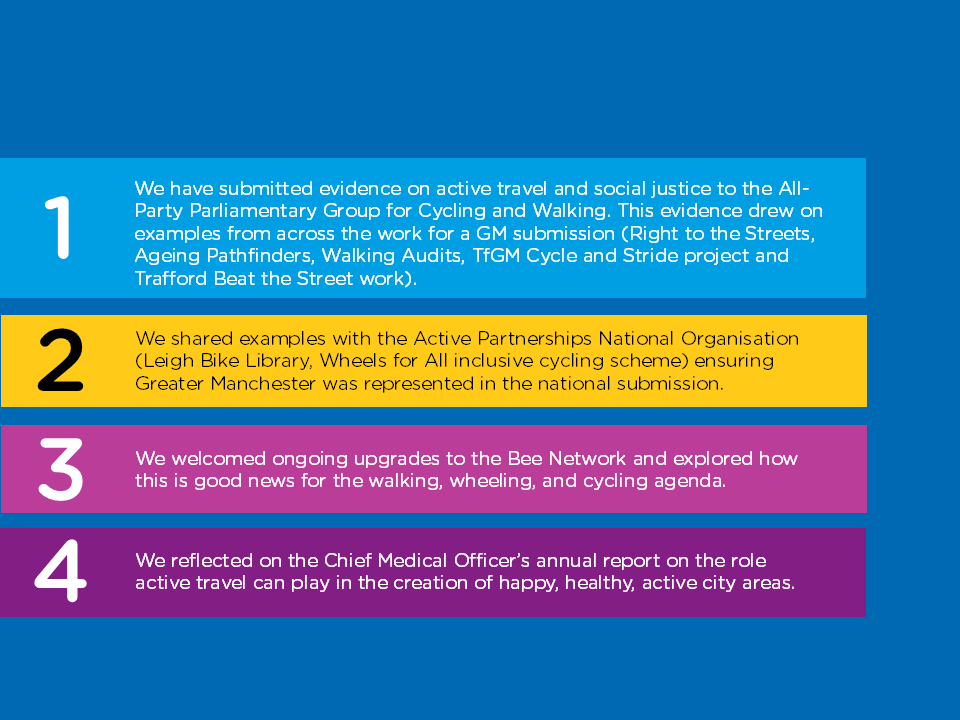
It’s been another impactful year, and we want to take this opportunity to share some highlights from the past 12 months.
Our shared impact
“The collaboration across Greater Manchester shows how powerful it can be when a whole system comes together around a shared purpose.”
Simon Hayes, Chief Executive – Sport England