Greater Manchester Activity Levels May 20-21: Ethnicity
A detailed breakdown of the latest Active Lives research from Sport England exploring the differences in activity levels by ethnicity across Greater Manchester.
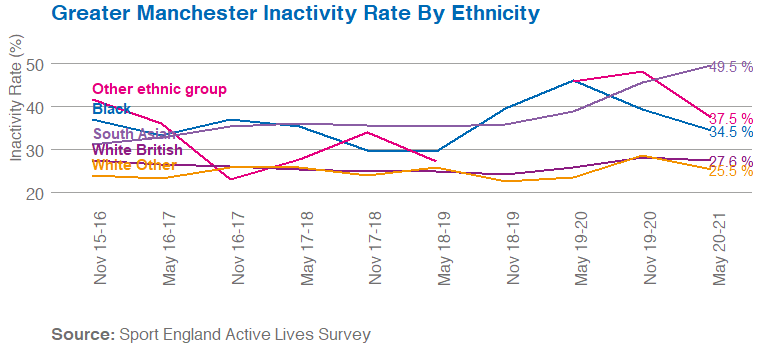
Since baseline, November 15-16, South Asians have seen the greatest increase in inactivity since baseline (+8.4%), whilst this has been a steady increase, there has been a much faster increase in inactivity since November 2018-19 with rates rising 13.6% in this time. White British, White Other and Chinese have also all seen increase in inactivity since baseline, but to a much smaller degree (+0.1%, +1.4% and +1.0% respectively). Whilst those who identify as Black have seen a decrease since baseline (-2.5%) there has been significant fluctuation in rates of inactivity with rates peaking 12 months ago at 46.2%. Other ethnic groups and those who identify as Mixed have also seen a decline in inactivity (-4.2% and -12.3%), however, there is not a full timeseries available making it harder to understand the patterns seen amongst these cohorts.

Find out more about the relationship between ethnicity and physical activity here.
More information on the latest Active Lives release can be found here.
If you have questions about this data please email: [email protected]
All data is rounded to one decimal point, you can access the raw data here.
