Greater Manchester Activity Levels May 20-21: Disability
A detailed breakdown of the latest Active Lives research exploring the differences in activity levels by disability and long term health conditions across Greater Manchester.
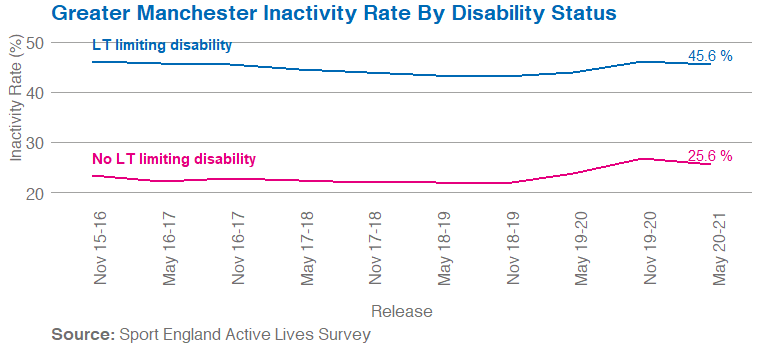
In Greater Manchester the inactivity disability gap is 20.0% and has narrowed since baseline (November 2015/16) by 2.7%. The cause of this is not simply decreasing inactivity, it has been driven by an increase in inactivity amongst those with no long term limiting disabilities (+2.2%) and a decrease in inactivity rates amongst those with long term limiting disabilities (-0.5%).

Borough Comparison
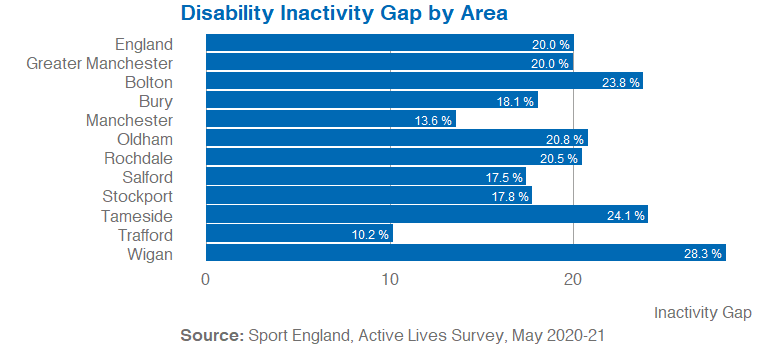
Greater Manchester has the same disability inactivity gap than England (20.0%) and five of the ten boroughs also have a smaller disability inactivity gap than England (20.0%). Since November 2015/16 seven of the ten boroughs have narrowed the activity gap, Bolton, Oldham and Wigan are the exceptions and have seen the gap grow by 5.2%, 2.7% and 4.9% respectively. Manchester and Trafford have both closed the gap by over 10% and 16.3% respectively.

Activity Alliance offer further information on the experiences of people with disabilities and long term health conditions and how to engage them in physical activity.
More information on the latest Active Lives release can be found here.
If you have questions about this data please email: [email protected]
All data is rounded to one decimal point, you can access the raw data here.
